“Ask Omegawave” is an educational series during which we will be engaging in informal Q&A sessions with members of Omegawave’s science team, including Co-founder Val Nasedkin and our Senior Research Scientist Roman Fomin.
As a numerical measure, Heart Rate (HR) is easy to define and compare—the calculation is derived from just two standardized components: frequency (the total number of beats) and time (a one minute duration of measurement). Heart Rate Variability (HRV), on the other hand, defies such simple explanation—measuring the fluctuating intervals between heartbeats, HRV as a numerical value ultimately depends on the variable(s) chosen and the method of analyzing those variables, with different practitioners choosing to collect their data over varying durations of time.
HRV, therefore, is not merely a calculation of change, but a methodological evaluation of changes. The time, frequency, and quality of these cardiac variations are regarded as a reliable indicator of the state of the autonomic nervous system (ANS). In order to assess the functional state of the cardiac system, Omegawave measures HRV from a standard ECG (via our chest strap and sensor) and applies over a dozen forms of analysis* (see appendix below), including statistical and spectral analysis, geometrical analysis (variation pulsometry), and non-linear and integral analysis methods.
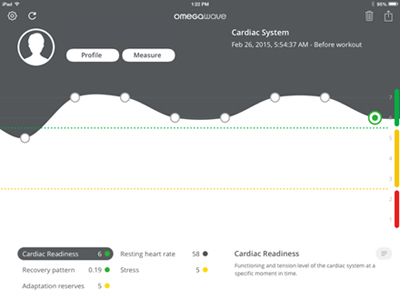
On the Omegawave Team system, each of these parameters are individually presented on the HRV dashboard; using Omegawave Coach & Individual, a comprehensive, integrated analysis of our HRV parameters is used to create the scores for the Cardiac index (System Readines, Recovery Pattern, Stress, & Adaption Reserves). In the following, we talk to Omegawave’s Val Nasedkin about Omegawave’s methods of assessing HRV.
Question: What makes Omegawave’s approach to calculating HRV different than many of the HRV apps that are currently available on the consumer market?
Val Nasedkin: For the calculation itself, we are using multiple methods to analyze HRV instead of one particular method. Because of that, we are getting a lot more data derived from HRV. Let’s separate two things—the norms for biology, and the norms for methodology. To establish these biological norms, we are doing a more inclusive type of assessment, we apply many different methods to analyze HRV. So, the more the better.
Q: Why is “more” better when it comes to HRV? If you use ten different—but reasonably accurate—types of scales to weigh someone, have you done anything more than weighed them ten times?
VN: Weight is not a very good example, but think of something similar, like body fat percentage. I can measure this in many different ways—I can use calipers, I can use the “pod” that’s using barometric pressure, I can use water [hydrostatic weighing]… all three methods measure body fat percentage, but none of them are precise. Using them together gives you a better answer, because you can start looking at how they are different from each other and then figure out something in-between, right?
We do the same thing—there are different methods to analyze heart rate variability. Mathematical methods, geometrical methods, spectral methods. Why do we do them all? Assume, for example, I use only the spectral method, and I’m assessing a marathon runner. The spectral method can be heavily influenced by breathing, but marathon runners are so efficient that they don’t breathe as often as the regular population. If I use only the spectral method on them, it might show that they are sympathetically dominant—because of their breathing pattern. But if I do a mathematical analysis on the same endurance runner, it might show that they are parasympathetically dominant. And then I do a non-linear method of analysis and it shows me that they are parasympathetically dominant. So, our expert system will say yes, they are parasympathetically dominant. But if I use just one method, I might make a mistake—that’s the point. So we use multiple methods and derive all kinds of different data from it. We have more variables that we measure than, say, a smartphone app that only measures one variable. One variable doesn’t mean enough—it’s very hard to say whether the behavior of that particular variable is good or bad.
If I measure only one variable, is it good [Draws a point and an ascending line radiating from it]? What about if ten other variables went this direction [Draws descending line from the same point]? Is it still good?
In order to measure as many variables as we can, we have to use different methods and apply them to HRV. That’s where we are different. A.) We apply more methods for analysis. B.) We derive more variables. And C.) Based on those variables, we apply our expert system that converts these variables into solutions. When these variables are in these combinations, what does it mean from a training standpoint? We don’t just give you raw data. From a training standpoint, we’ll tell you something practical like you need to decrease your intensity, increase your velocity, whatever.

Q: Is there such a thing as “good” HRV versus “bad” HRV?
VN: It depends on what system they use. If they use ours, they can see their cardiac system in the green zone and say yes, my HRV is good. If they use certain other apps, no, they cannot. There is a popular HRV app that measures only one parameter—this parameter represents the functionality of the parasympathetic system. In their case, the vector that goes up, is always good. Always. So if the trend is up, it means the parasympathetic system is increasing, great. But what if the norm for the parasympathetic system is here…[draws a point, then a line that then rises well above the norm]?
We have these unique norms that we set based on years and years of research in sports. We established them by observing thousands of athletes, and we can compare where you are in relation to the norm, so our expert system can approximate what type of training you should do to move you as close to the norm as possible. The only way that you can say if HRV is in a positive or negative state is if you compare it to the norm—and if you don’t have the norm to begin with, it’s just a floating number.
Q: So for your average runner, cyclist, triathlete using Omegawave Individual, is there a point where consistently stable HRV is a bad sign? Do they want to see some fluctuation?
VN: Of course—they should overload their systems. Always being in the green is not necessarily always good.
Q: Why would an athlete not want to just look at HRV as their sole barometer of recovery?
VN: HRV is part of our solution. And not just HRV—advanced HRV. But by no means is it the only thing that we do. Sometimes an athlete will have perfect HRV—perfect HRV—but still not be able to perform because their central nervous system, or their hormonal system, or their energy supply systems are kaput.
Just like with HRV, it’s a matter of how many parameters are you looking at in combination? HRV is great, but what about all the other parameters. And if they are not good, who cares? The athlete is still going to struggle. You can explain it from the standpoint of limiting factors. There are so many limiting factors that can be involved—the fact that one is not a limiting factor doesn’t mean the organism overall is in a perfect state.
*APPENDIX: OMEGAWAVE HRV PARAMETERS
5 Russian Parameters:
Activity of the vagus regulatory mechanism: Indicates the current activation level of the parasympathetic nervous system’s regulation of the cardiac system, which serves to maintain homeostasis and restore the functionality of the body after load.
Activity of the sympathetic regulatory mechanism: Indicates the current activation level of the sympathetic nervous system’s regulation of the cardiac system.
Tension Index: The level of tension in the cardiac system in response to physical and mental loads. Reflects the level of centralization of heart rhythm regulation. Centralization involves increased involvement of central levels of regulation and a decreased level of autonomic regulation of heart rhythm.
Share of the aperiodic influences: Reflects the level of random and aperiodic activity that influences heart rhythm. Slow waves reflect activation of the central circuit and a predominance of activity in the cardio-stimulatory center (which is part of the medulla). Ex: over-trained athletes express slow waves in a significant manner.
Standard deviation of the aspirate waves: Reflects the level of automatization of heart rhythm regulation. Automatization involves a predominance of autonomic regulation and a decreased responsibility of central levels of regulation.
Time & Frequency Parameters (consistent with the European Society of Cardiology & the North American Society of Electrophysiology):
SDNN: Standard deviation of the full array of cardio intervals. Reflects the total effect of autonomic regulation.
SDSD: Standard deviation of differences between adjacent normal to normal intervals.
RMSSD: The square root of the sum of differences of a sequential series of cardiointervals. Reflects the parasympathetic activity.
Total Power: Variance of all normal-to-normal intervals, ≤0.4 Hz. Reflects the level of activity of regulatory system.
Low Frequency/High Frequency (LF/HF): Ratio between low and high frequency components. Reflects the Sympathetic-Parasympathetic Balance. Ratio LF [ms2] / HF [ms2]
High Frequency (HF): Power in high frequency range 0•15–0•4 Hz. Reflects the parasympathetic activity.
High Frequency, normalized units (HF n.u.): HF power in normalised units. HF/(Total Power–VLF) x100, n.u.
Low Frequency (LF): Power in low frequency range 0•04–0•15 Hz. Reflects the sympathetic activity.
Low Frequency, normalized units (LF n.u.): LF power in normalised units LF/(Total Power–VLF) x 100, n.u.
VLF: Power in very low frequency range ≤0•04 Hz. Reflects the humoral activity.