
When using Omegawave (or any form of monitoring technology), it can be difficult to place the raw numbers in a context that directly applies to your training and your life. As you collect and save data over time, challenges can arise in terms of remembering specific workouts or the ways individual training sessions have impacted subsequent measurements. By using a simple spreadsheet tracking system, you can view your daily subjective and objective information in a way that lets you see “The Big Picture.”
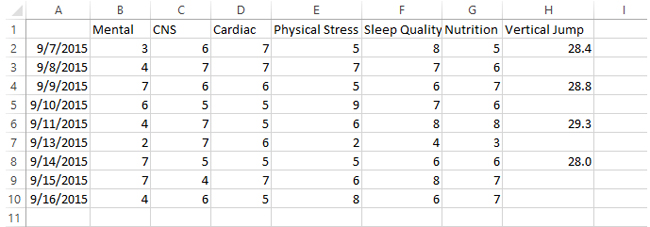
To help understand your assessment data and how it can be used, it’s best to think of the human body as a system with three main categories of data: Internal Load, External Load, and Performance. All of the stressors imposed on your body (both physical and mental) and how well you take care of yourself will play a role in how effectively your body as a system will perform. While you can track a range of different variables, for the purpose of this example I’m focusing on the following factors:
Internal Load will include the functional states of multiple biological systems (we’ll use Cardiac Readiness and CNS Readiness from Omegawave) and perceived mental stress (this could be a combination of work stress, social stress, emotional stress, etc).
- Mental Stress (1-10 subjective scale; 1 = no mental stress, 10 = “pulling your hair out” stressed)
- CNS Readiness (1-7; objective measure from Omegawave)
- Cardiac Readiness (1-7; objective measure from Omegawave)
External Load will include perceived physical stress from that day (includes exercise and your everyday movement), perceived quality of sleep, and perceived quality of your nutrition.
- Physical stressors (1-10 subjective scale; 1 = no stress, 10 = maximum stress)
- Quality of Sleep (1-10 subjective scale; 1 = worst, 10 = best)
- Quality of Nutrition (1-10 subjective scale; 1 = worst, 10 = best)
Performance will be an objective measurement of a performance test. This could be something as simple as a 1-mile run time, 40-meter sprint times, vertical jump test, etc. If you do not have a way to objectively measure performance, you can always give a subjective score of how well you think you performed in competition, a training session, etc.
- Performance (Objective performance test [or 1-10 subjective performance scale])
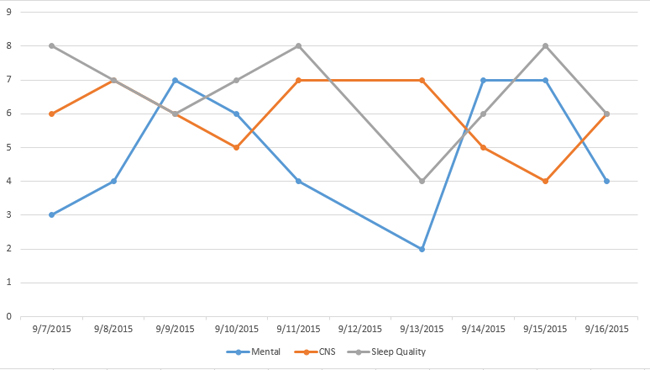
Once you’ve gathered a representative sample of your data, you can then start identifying trends as they relate to “The Big Picture.” You may see a performance decrease on days that follow low nutrition scores, or possibly a mental stress increase the day after a poor night of sleep. Ultimately, you have to remember that Omegawave (and all other forms of monitoring data) are just one piece of the puzzle. The real challenge is trying to piece it all together—the more you understand how each piece fits together, the better you’ll see “The Big Picture.”