
We recently sat down with a client of ours from Oslo, Norway to discuss his quite remarkable experience with Omegawave. This individual currently works in the Norwegian Police force, where he holds an executive position. When it comes to his athletic career, he has been very active from young age. His primary competitive sports were cross-country skiing and orienteering. He was always in the upper segment of his age group in cross-country skiing during his youth. Nowadays, he still maintains a very active lifestyle.
Omegawave (OW): How did you find out about Omegawave?
I heard about it through another Omegawave user here in Norway. He has been using the professional system for years as a coach.
OW: Can you elaborate more on your measurement process: when do you measure (morning/afternoon), how many times per week?
I measure primarily in the morning before I leave for work. The frequency varies: some weeks I measure three to four times, while on others I measure myself only once.
In general, I try to have the same morning procedure so that the environmental conditions for the measurements would be as similar as possible.
OW: What did you see in your Omegawave results that made you worry and reach out to us?
Well, I started having multiple poor measurements in January 2017 (all Windows of Trainability in red state). First, I contacted that local coach I mentioned earlier and he told me about his professional Omegawave system that allowed you to see the ECG signal and other more in-depth HRV analyses. We had a look at my results with him and then I decided to contact you directly to ask for your advice on the results and also see if I could personally get hold of this data so I could see it for myself and also take the data to a cardiologist.
OW: What happened next?
First, I showed the Omegawave ECG raw data and scattergram to two cardiologists. They quickly understood that there was potentially something wrong. They subsequently prescribed more advanced testing and inspections in order to reach a medical diagnosis.
Eventually they found the root cause for my heart rate disturbance and their diagnosis was atrial fibrillation. Based on this conclusion they recommended a minor heart operation to improve my condition and in May of this year if finally had it. So far, all seems to be good!
Below (Fig. 1 & 2) you can see some of my poor cardiac results from the period when I started observing the problems.
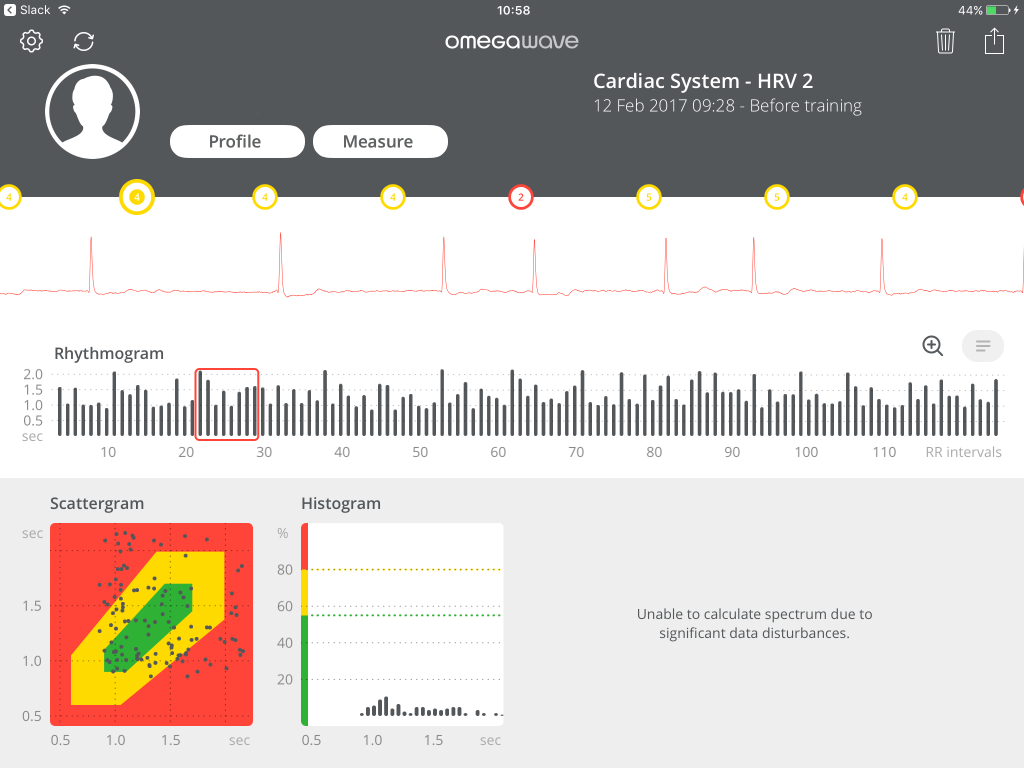
Figure 1. ECG and HRV data showing anormal arrhythmia
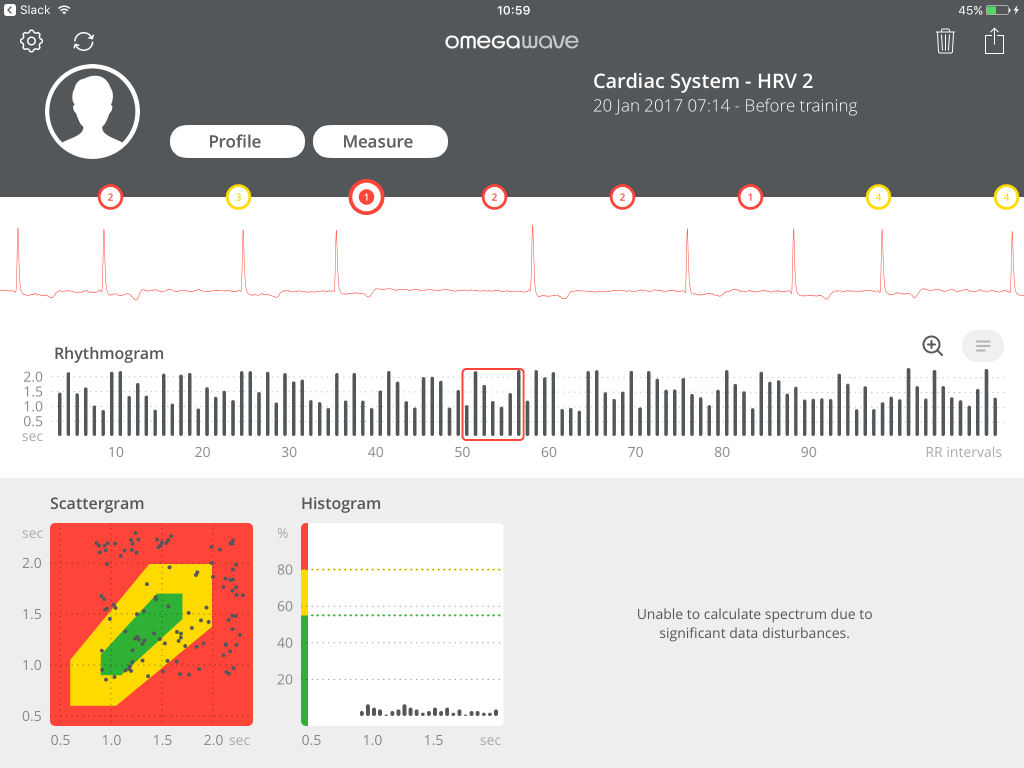
Figure 2. See the end of the article for a detailed explanation of the different graphs
OW: How is your recovery going and are you back to normal training?
I was back to light and easy training 4 weeks post-surgery. Currently, I am back to more normal training, but I still avoid high intensity interval training. The cardiologists recommended that I wait 3-4 months before engaging in such intense activities.
Thank you for sharing this personal story with us! We hope you are back to normal training as soon as possible!
How to interpret different Omegawave measurements
The new Omegawave Coach+ allows you to see the raw ECG and HRV data for deeper analysis of the cardiac system. The starting point of using this information to your advantage is to analyse the patterns in our different graphs.
To make matters concrete, ideally you want to see a cloud pattern on the scattergram and a normal, symmetric distribution curve in the histogram. In other words, the optimal shape of the cloud—reflecting optimal HRV—takes the form of an ellipse, placed more or less in the middle of the green area. The individual in Figure 3 demonstrates a very good case of optimal cardiac state measured at rest.
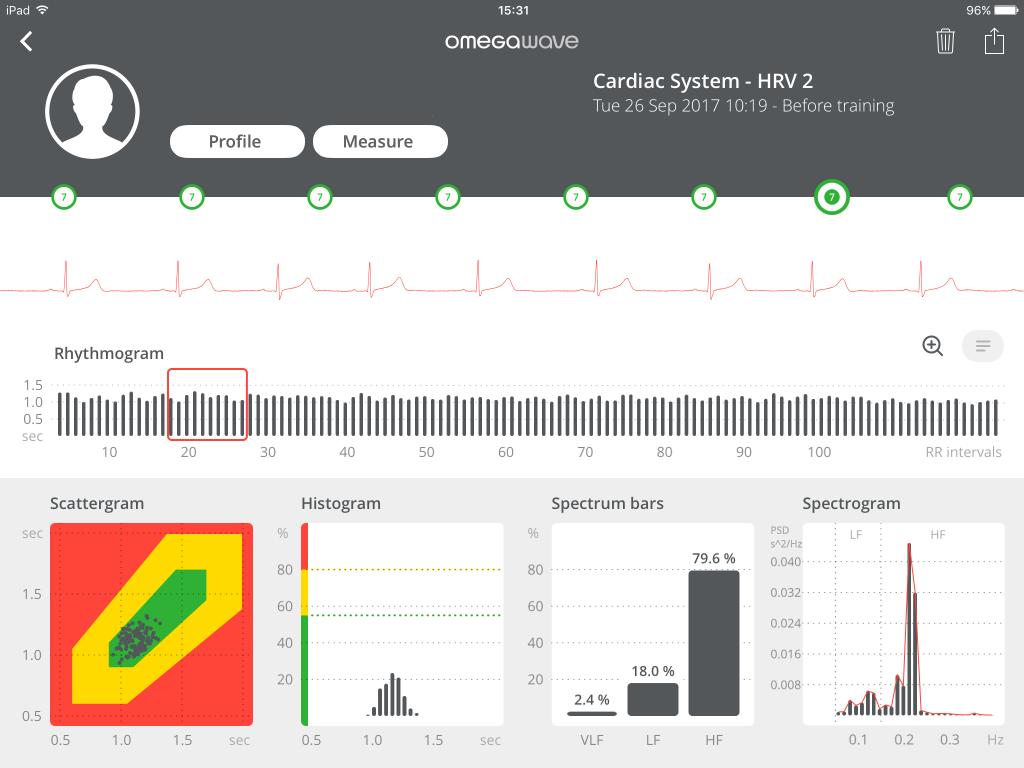
Figure 3. Optimal cardiac state at rest
On the other hand, if you see a very tight, compact cloud (like a point) on the scattergram, it would reflect low HRV. Having little variation in the heart rhythm is not a desired functional state for an individual measured at rest. In the histogram, this would show up as one or only a few tall bars as all or most of the R-to-R intervals are of same length, thus reflecting rigid rhythm. Figure 4 demonstrates this type of scenario.
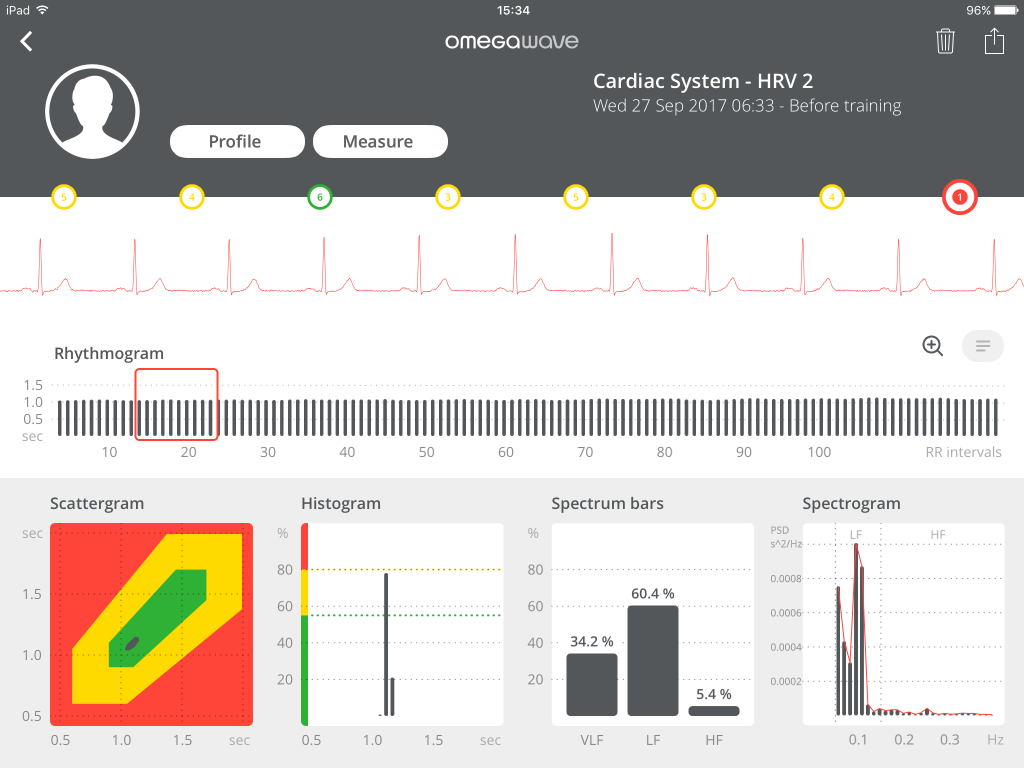
Figure 4. Low HRV – the cardiac system is still stressed
Finally, having a cloud that is too spread out is also undesirable, as it reflects too high HRV, in other words, too high a parasympathetic state (Figure 5).
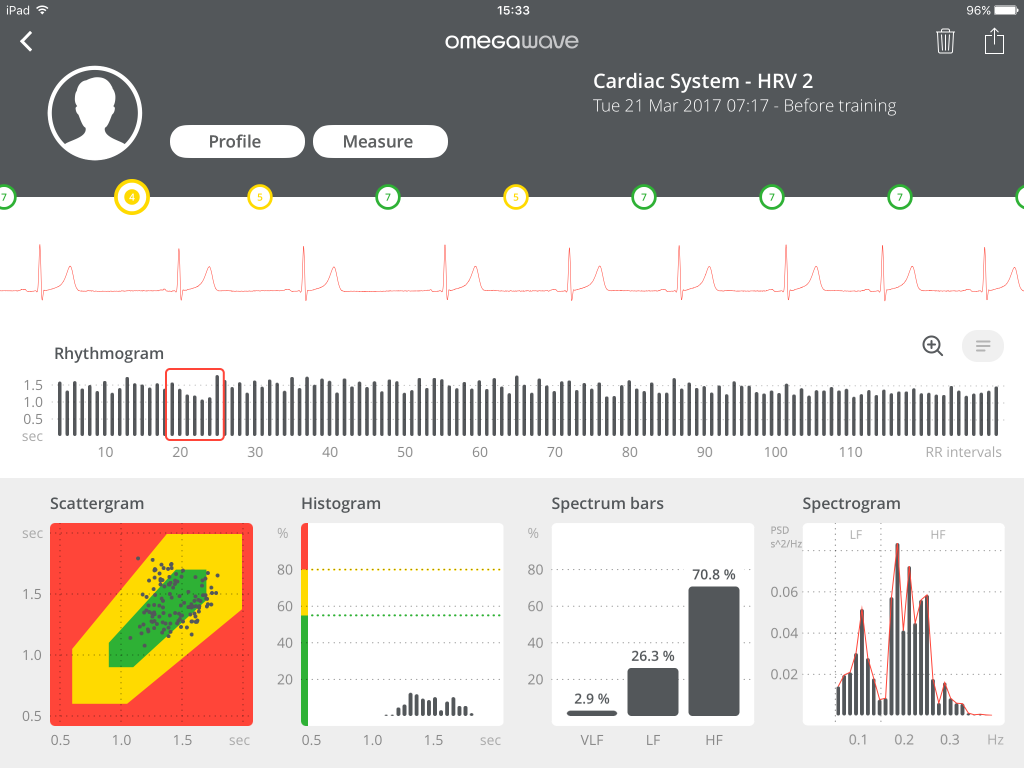
Figure 5. Too high HRV – the autonomic nervous system has not fully recovered
Additional benefits from analyzing the scattergram are that you can almost immediately recognize outliers in RR intervals and visually identify abnormalities in the rhythm regulation.
Finally, on the rhythmogram we ideally want to see some variations, but not too high. We don’t want to see too high or too low bars. So, you can apply your visual evaluation on the qualitative side, and use the numbers for the quantitative analysis.
Finally, having access to the raw ECG signal is a huge benefit as well because it gives us a chance to observe adaptations or maladaptations of the heart, beyond the regulatory information of HRV. Just like in the interview above, this data can be easily sent via the Coach+ application to a medical professional for further interpretation. In conclusion, analysing the cardiac system beyond heart rate variability is a great benefit as it allows you to see different types of arrhythmias and other anomalies that simple HRV does not detect.